

2021 Year in Review of Online Fundraising - how much was raised in total?
A post dedicated to how much is being raised each year globally online. I will update it throughout the year as I find out more data. My hope is this encourages more transparency.

Now it’s the end of January 2022 I don’t think we are going to get many more Year in Review reports. I wanted to go through as many of them as I could to get a snapshot of how much of the $400B+ in nonprofit fundraising is happening online. As this is the first time I have done this and the information is incomplete, I realise this exercise is imperfect. But it’s a start and my plan is to keep coming back and updating this post as I get more information. Hopefully 2022 and beyond we will be able to get a better picture.
p.s. if you are interested in Social Fundraising you might wan to check out the Social Fundraising Summit I’m hosting in Dublin in March. Details here.
GoFundMe


GoFundMe’s 2021 Giving Report is interested but it doesn’t say how much they raised for nonprofits specifically in 2021. GoFundMe did mention that “The GoFundMe community has raised $15 billion since 2010”. This means the average raised per year would be $1.36B. So my guess for 2021 would be around $2B mark, maybe more.
Classy


Classy’s Year in Review post is really transparent. Well done Classy! Classy surpassed $1B again keeping up their huge growth in 2021 to get to $1.143 billion.
Loads of useful stats in this one and well worth a review here.
4.6 million donors / 12.9 million donations (so a lot of repeat donors!)
73% year-over-year increase in recurring giving revenue
Largest individual donation was $360,000 🤯 (wondering if this was done online via Stripe? That’s fees of like $7,200!)
813k recurring donation plans on Classy
278k fundraising pages
JustGiving


GBP £498m which at the time of writing is $676m. However it turns out this does not include everything.

I’m not sure of the size of direct donations and recurring donations on JustGiving and not sure why they didn’t add it in here (my guess is that this is not a transparency issue, more of a technical one or that it could be because it is small and didn’t make that much difference). Therefore I don’t want to assume it’s large.
Blackbaud closed EveryDayHero in November 2020 so I’m assuming EveryDayHero is now included in JustGiving figures?
So let’s estimate $700m for JustGiving in total in 2021. We can update the figure later if we hear more.
Facebook Fundraising
Not released 2021 figures yet but 2020 was $2B at a 70% year on year growth rate. 2020 was a unique year and these are big numbers to grow so I would put a reduced 25% growth estimate resulting in a guess of $2.5B.
(interestingly Facebook charges 0% fees both for their platform and for payments. $2.5B at 3% average payment card charges have saved nonprofits $75m and 5% platform fees (Tiltify charge this for example) have saved $125m. So that $200m I estimate Facebook have saved nonprofits this year alone. That’s more than most other platforms raise!!)
GivePanel


GivePanel raised $226m in 2021 from just 300 nonprofits. However at GivePanel we are not really a fundraising platform in our own right so much as an extension of Facebook Fundraising. I just didn’t want to leave us out or you might think I was not being transparent! You can read our full 2021 year in review here.
So nothing to add to the final total as its included in the Facebook fundraising figure.
Tiltify
Unfortunately I couldn’t find a total raised from Tiltify.
This Forbes article from 2020 mentioned:
The company said it is on track to raise $100 million for various digital campaigns by year’s end.
They also said in a Linked In post that did say that the average per campaign raised was the highest in the industry at $1,300. In their 2020 recap they said 1,000 causes had nearly 44,000 fundraising campaigns.

Let’s guess that they have 70,000 fundraising campaigns in 2021 (could be a LOT more) and that each one raised $1,300. That’s $91m raised.
I will estimate this as a round $100m until we find out more.
StreamLabs fundraising
Streamlabs is the software that most streamers use to broadcast on Twitch and Youtube. Not long ago they launched a fundraising tool that is completely free for nonprofits. It’s growth has been really impressive (albeit from a low base). They are also very transparent with what they are raising.


Funraisin

Our friends at Funraisin reported $320m raised in 2021. They are an Aussie based company but they are pretty global now so I am going to guess this is in USD. I will check with them and report back though if it is AUD.
Growth wise they mention that they have raised $850m in the last 5 years. This means that 2021 figures are 88% over the average. Another way of look at is that 38% of what they have raised over the past 5 years. Feels like strong growth to me. For me they are one of the key platforms to watch!
Raisely


Australian based platform Raisely said they raised over $200m from 1,500 nonprofits. Assuming that is Aussie dollars then that’s another $144m USD. Impressive.
The Giving Block
So great to be talking about Crypto Giving! The Giving Block have just released a really transparent report!

The total donation volume on The Giving Block in 2021 was $69,644,535, an increase of 1,558% from 2020.
The average crypto donation size on The Giving Block in 2021 was $10,455, an increase of 236% from the previous year.
NFT projects donated $12.3 million to charities via the Giving Block in 2021.
Amazing numbers. I think we’ll see Crypto Giving keep growing and growing in the years ahead!
PayPal
PayPal said that in 2020 they processed $17.3B of donations (read my full account of PayPal’s huge fundraising impact here)
How much would you guess that PayPal generated in online donations in 2020?
Listening to this podcast episode the other day (it’s really great and worth a listen if you are in digital fundraising) I was shocked to find the answer is a mind-blowing $17 billion!
This feels very high to me and 2020 could have been an outlier year (with a lot of Covid funds being set up etc). So I am going to discount 2021 by 50% down to $8.65m.
Also - we have to acknowledge that PayPal is different in that it’s part of the underlying payments infrastructure that most fundraising platforms use. This results in an overlap between PayPal and fundraising platforms that mean we could be double counting. I’m going to guess this overlap at 20% for now taking my guesstimate for PayPal down to $6.9m.
Platforms where I couldn’t find any information but would have liked to
Blackbaud - could not find a year in review post from them about what their nonprofit fundraising products raised (other than JustGiving). TeamRaiser for example.
FundraiseUp, Funraise, iRaiser, DonorBox, BSD tools, ActBlue - could not find a year in review post from them.
We said goodbye to Virgin Money Giving in the UK this year - not sure what they raised in 2021
Stripe - So many services now use Stripe it would be amazing to have a nonprofit raised figure from them. I don’t see this happening soon. Perhaps an initial number I could find out is how many nonprofits they have on their payment platform. Even if we got the total number of nonprofits, Stripe powers so many of the above fundraising platforms it would be impossible to unpick what nonprofits raise. A bit like PayPal above, with Stripe we would be double counting.
“Other” Donation Forms - who knows how much is coming through just online donation forms that don’t use any of the services above? There are hundreds of other company’s that process donations for charities. Will we ever know?
Any other obvious one I’m missing?
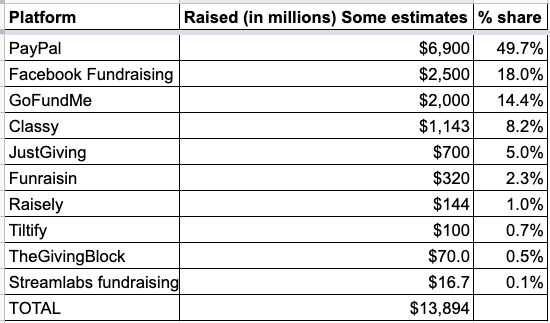
Adding it all up
So here are my estimated totals. I know this will be wildly wrong and is unbelievably imperfect but I wanted to make a start so that over the coming years we might get a better picture of what is going on.
A final thought: We need more transparency
As a nonprofit sector we do not have a good understanding of how much of the $400B+ we are raising is coming from online. Looking at the above its at least $14B but could easily be double or even triple that (or more) if you include the whole nonprofit fundraising eco-system.
There is no consistency of reporting across the different platforms and there are both incomplete reports as well as misleading ones. (One platform published their Year in Review figures for 2021 but included the total raised for the whole decade they had been in business!)
This results in conversations like this one:

Wouldn’t it be great if every platform reported their Year in Review with the same agreed comparable metrics?
Here is a stab at a framework for what this could look like:
Total number of active nonprofit customers on platform
Total Raised in the year (all customers)
Total number of donations and average donation value
Total number of fundraisers and average raised per fundraiser
Total number of supporter contact details collected with marketing opt-in %
Overall % platform fees charged to donors
Overall % platform fees charged to customers
Overall % payment processing charge to customers
At some point I would like to dedicate more time to getting online platforms to report in a consistent manner as I think this transparency would really help the sector.
If you are from a fundraising platform company or know any more details I’ve missed and want to provide any more information to this post please get in touch. I’ll keep updating it throughout the year.